The timeline view
The stage pipeline on the run-detail page answers “where is the run now?” The timeline view answers “how did it get here?” It is a Gantt-style swimlane chart: one row per stage, one bar per iteration, all laid out along a single time axis. Loopbacks — the moments when a downstream stage sent work back upstream — are drawn as arrows that connect the iteration that caused the loopback to the iteration that resumed it.
It’s the fastest way to triage a long run: at a glance you see which stage burned the time, where the loopbacks happened, and (for Implement) which bead each iteration was working on.
Opening the timeline
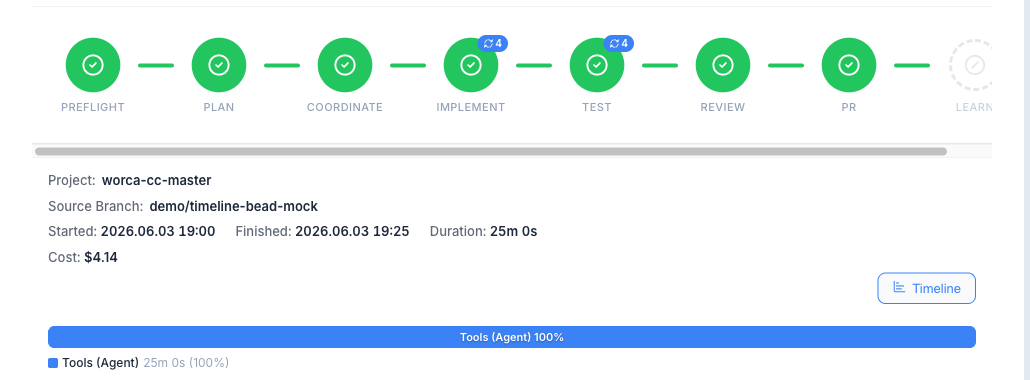
Section titled “Opening the timeline”Every run-detail page has a Timeline button on the pipeline timing bar. Clicking it deep-links to #/history/<runId>/timeline — bookmarkable, shareable, and resumable after a refresh. The back arrow returns to the run-detail view without losing scroll position.
What you’re looking at
Section titled “What you’re looking at”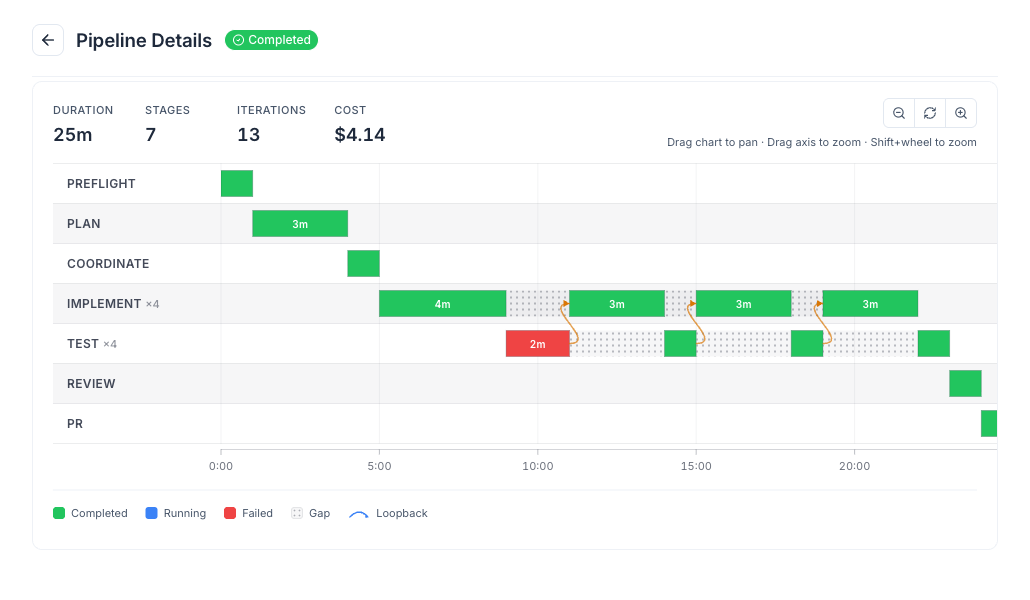
- Rows are stages, ordered top-to-bottom in pipeline order (Preflight → Plan → Coordinate → Implement → Test → Review → PR → Learn). Stages that produced no iterations are hidden so the chart stays compact.
- Bars are iterations. Each bar is colored by stage hue; the fill darkness reflects status — success is saturated, failed is washed-out, in-progress carries the active hue. The duration is rendered inside the bar when it’s wide enough to fit.
- Gap bands between consecutive iterations on the same row show where time was spent somewhere else. A tooltip names the stage that owned the gap (Implement → Test → Implement leaves a gap on the Implement row attributed to Test).
- Loopback arrows connect the iteration that triggered a return (e.g. Test iter 1 failed) to the iteration that resumed work upstream (Implement iter 2). Arrows are blue going down-and-back, amber going forward — matching the project’s docs-site diagram language.
- The axis sits at the bottom and adapts its tick interval to the current zoom — minute-level when zoomed out, second-level when zoomed in.
Hover for the iteration’s vital stats
Section titled “Hover for the iteration’s vital stats”Hovering an iteration bar pops up a tooltip with everything you need to triage that single step:
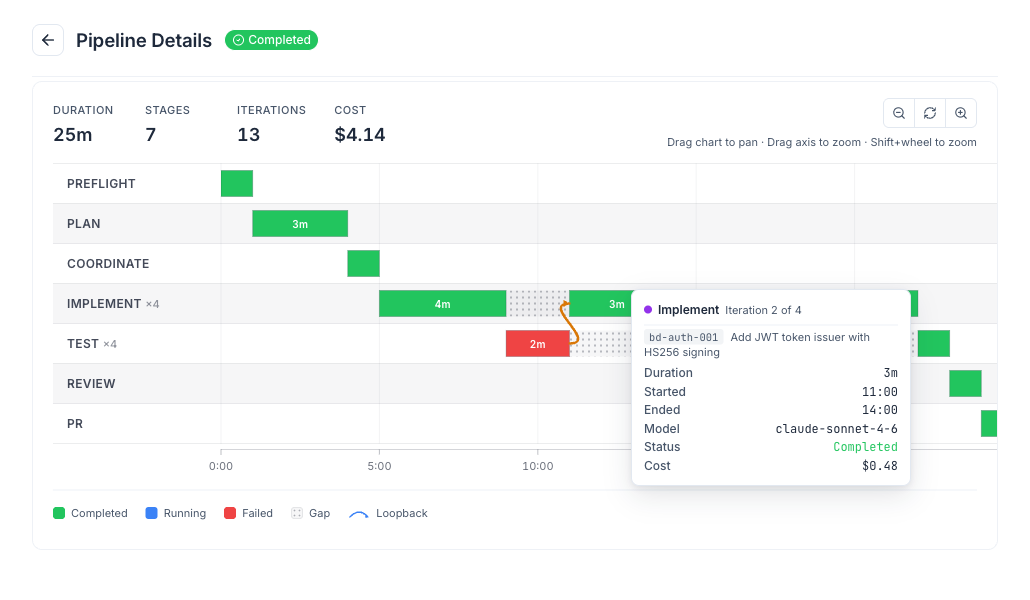
- A stage label + “Iteration N of M” header.
- For Implement iterations: a sub-header line under the title with the bead being worked on — a monospace bead id in a subtle pill plus the bead title. This is the fastest way to map an iteration back to the unit of work it was claimed against. Other stages don’t claim beads, so the line is omitted on Plan/Test/Review/etc. iterations.
- Standard rows: Duration, Started, Ended, Model, Status, Cost.
Hovering a gap band instead surfaces what was happening during that gap: which stage held the work, how many iterations it took, and when control returned.
Click for the full drawer
Section titled “Click for the full drawer”Clicking any bar opens an end-positioned drawer with the iteration’s full record:
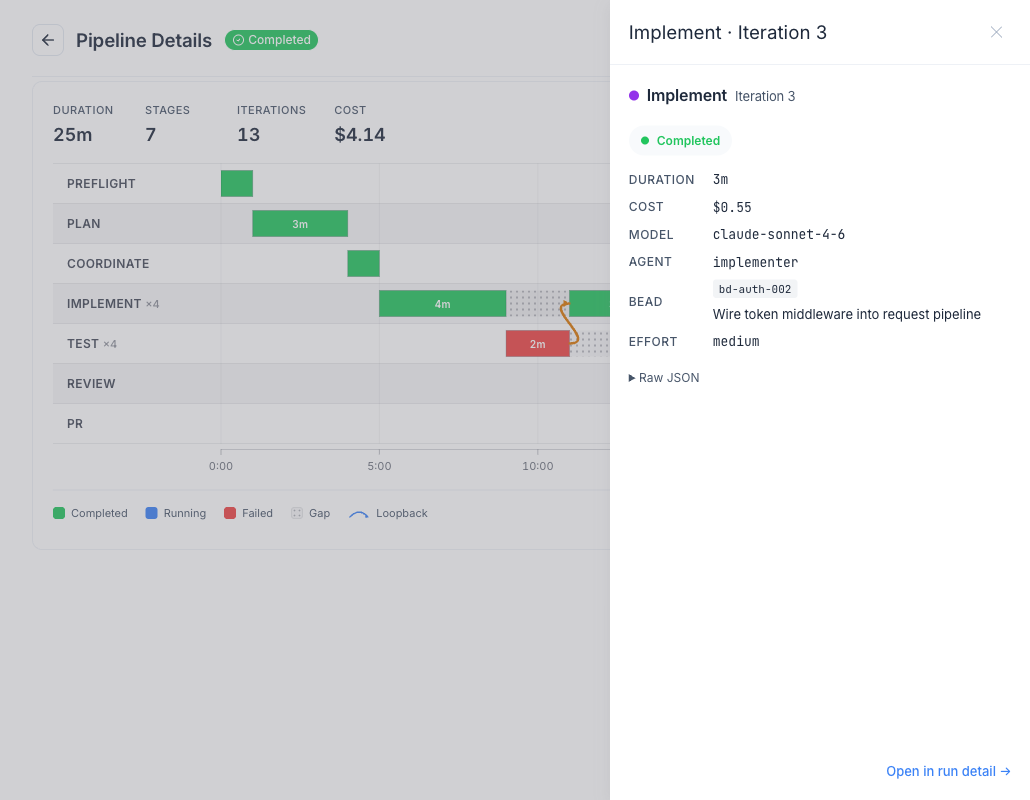
- Status pill + colored status text at the top.
- Duration, Cost, Model, Agent rows.
- Bead row (Implement only) — the same monospace-id + title layout the tooltip uses.
- Effort badge — the reasoning level the iteration ran at (
low/medium/high/xhigh/max). See Tuning effort for the resolution rules. - Tokens — input / output / cache, when present.
- A collapsed Raw JSON
<details>block for full inspection without leaving the page. - A footer link Open in run detail that jumps to the exact iteration row on the run-detail page.
The drawer can also be opened from the keyboard: focus a bar with Tab, then press Enter or Space.
Zooming and panning
Section titled “Zooming and panning”By default the timeline fits the whole run window in view. Zoom in to disambiguate dense bars or out to see the macro shape.
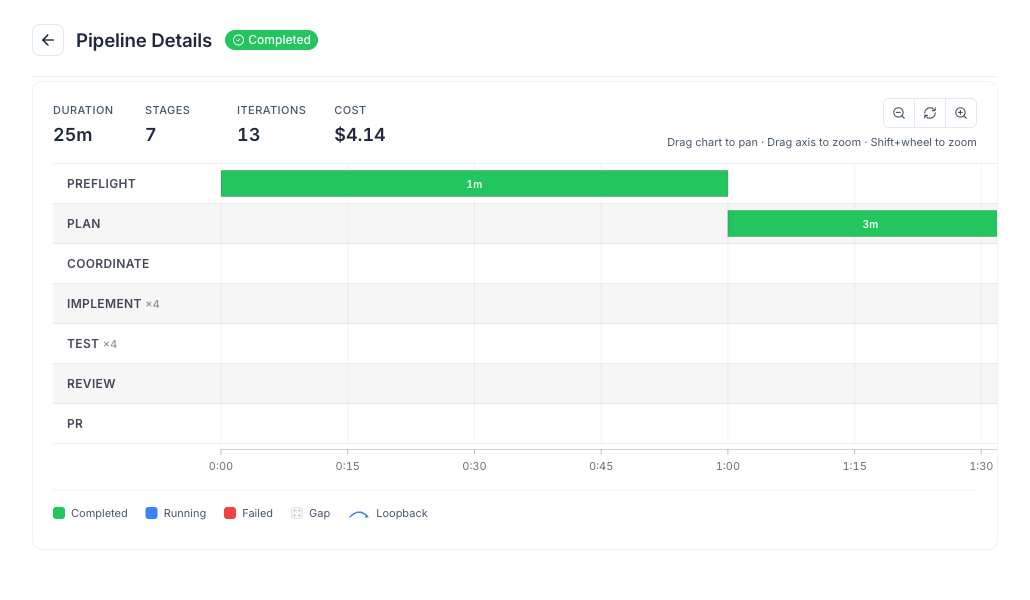
Four ways to zoom:
| Gesture | Effect |
|---|---|
| Toolbar buttons (top-right of the chart) | + doubles the scale, − halves, ⟲ resets to fit-to-run. |
| Shift + mouse wheel | Zoom anchored at the cursor’s time. |
| Plain mouse wheel | Horizontal pan (no scale change) — matches Mac trackpad two-finger swipe. |
| Drag-select on the time axis | Drag a window on the bottom axis ribbon to zoom directly to that range. |
Zoom is clamped between fit-to-run (1×) and 32×. The reset button restores the fit-to-run baseline.
Keyboard navigation
Section titled “Keyboard navigation”Every bar and gap is focusable and announced with an aria-label summarising the stage, iteration, duration, and status:
- Tab / Shift-Tab move through bars in pipeline order.
- Enter or Space on a focused bar opens the same drawer as a click.
- Esc in the drawer returns focus to the bar that opened it.
Loopback arrows are decorative — they carry aria-hidden="true" so the screen-reader experience matches what the keyboard does.
Active runs stream live
Section titled “Active runs stream live”When the run is still in flight, the timeline streams over the same WebSocket as the rest of the page — new bars and arrows appear as the pipeline advances, and the right edge of the chart tracks “now” so in-progress iterations remain visible. The view bypasses its render cache while the run is active to keep the picture honest.
Dense rows
Section titled “Dense rows”If a single stage accumulates more than 30 iterations, loopback arrows on that row are suppressed and a small hint appears so the row stays scannable. The bars themselves stay clickable; only the visual clutter of N-to-N arrows gets hidden.
When to reach for it
Section titled “When to reach for it”- Triaging a slow run — the dominant bar tells you which stage to look at first.
- Auditing a loopback — follow the arrow from Test iter N back to Implement iter N+1 and click to read both records.
- Confirming bead coverage — for Implement, the bead sub-header lets you see at a glance whether iter 1, 2, 3 were the same retry or three separate beads.
- Sharing a run — the URL is a deep-link; paste it into chat and the recipient lands on the same view.