Monitoring a run
Once a run starts, the run detail view streams everything over WebSocket — no polling, no refreshing. The page updates as the pipeline moves.
The stage pipeline
Section titled “The stage pipeline”The run is shown as a sequence of stages. Each stage card carries its iteration count, cost, duration, and a timing bar that splits Thinking time from Tools time. Stages light up as the pipeline reaches them and loop back when work needs another pass.
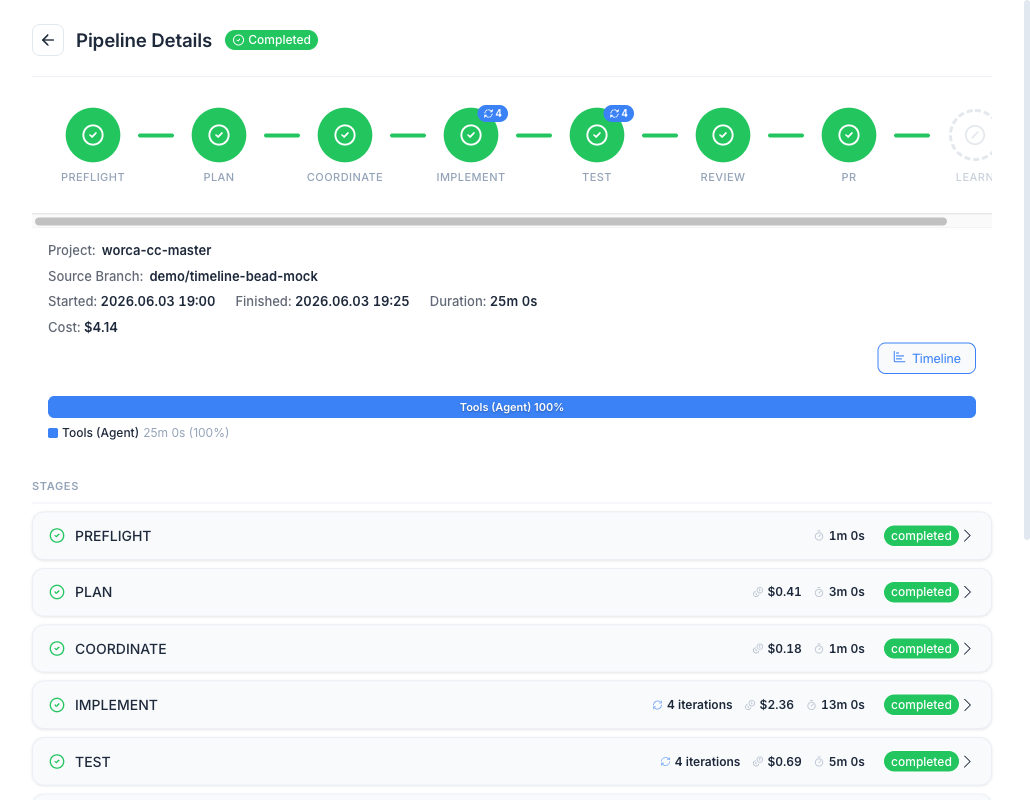
Drilling into a stage
Section titled “Drilling into a stage”Expand any stage to see its individual iterations. Each iteration row shows:
- the agent, its turns, cost, duration, and outcome;
- an effort badge — the reasoning level the iteration ran at (see Tuning effort);
- a
Context: X%chip — how full the agent’s context window was when the iteration ended. Appears once worca records a final context measurement at iteration close; on single-iteration stages it also appears on the collapsed stage info-strip so you don’t have to expand to see it. - Tools / Skills / Subagents rows, each item badged allow (green) or deny (red) by the governance rules, with a Lockdown chip when a section is set to
none.
The expanded Agent Instructions panel separates the resolved system prompt from your work-request message, so you can see exactly what the agent was told.
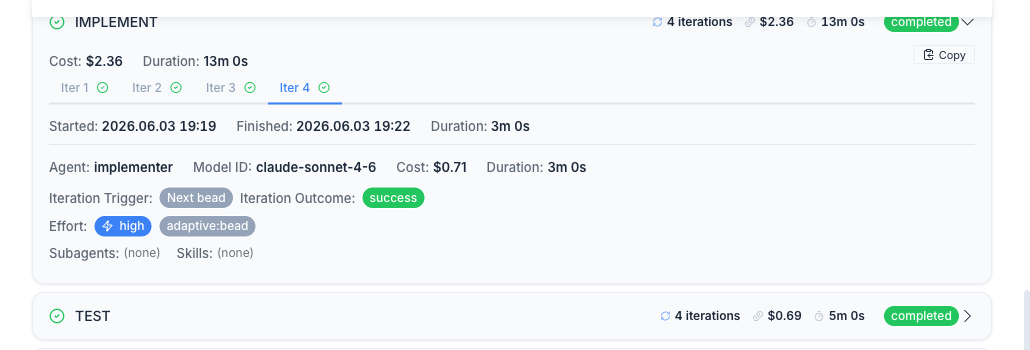
The timeline view
Section titled “The timeline view”The stage pipeline answers “where is the run now?” The timeline view answers “how did it get here?” A Timeline button on the pipeline timing bar opens a Gantt-style swimlane chart: one row per stage, one bar per iteration, with loopback arrows drawn between the iterations that triggered and resumed each retry. For Implement iterations, the tooltip and drawer also surface the bead id + title the iteration was claimed against.
See The timeline view for the full walkthrough — interactions, zoom controls, keyboard navigation, and active-run streaming.
The log viewer
Section titled “The log viewer”The log viewer streams real-time agent output with per-stage filtering — follow the Implementer’s reasoning, the Tester’s command output, or the Reviewer’s verdict as it happens. Agent prompts, guides, context artifacts, and bead tooltips render as sanitized Markdown.
Cost and tokens
Section titled “Cost and tokens”The Token & Cost view breaks the run down per stage with a proportional bar chart and a per-iteration table (cost, turns, duration, API duration). Pricing comes from your project settings, so the figures reflect your configured model rates.