The Access Map
The timeline view answers “how did the run spend its time?” The Access Map answers a different question: “what did the run actually touch?” It is a file-access telemetry view — a matrix of every file the agents read or wrote, broken down by the stage and iteration that touched it, alongside the searches they ran and a measure of how trustworthy that telemetry is.
It’s the fastest way to see where a run’s attention went: which files the planner read to orient itself, which files the implementer rewrote, whether the agents grepped the whole repo because they couldn’t find something, and whether any writes slipped past worca’s tracking.
Opening it
Section titled “Opening it”From a run’s detail page, click Access (next to Timeline in the timing bar). File-access telemetry is on by default (worca.telemetry.file_access.enabled); runs created before it shipped — or with the setting turned off — show an empty state instead of the matrix.
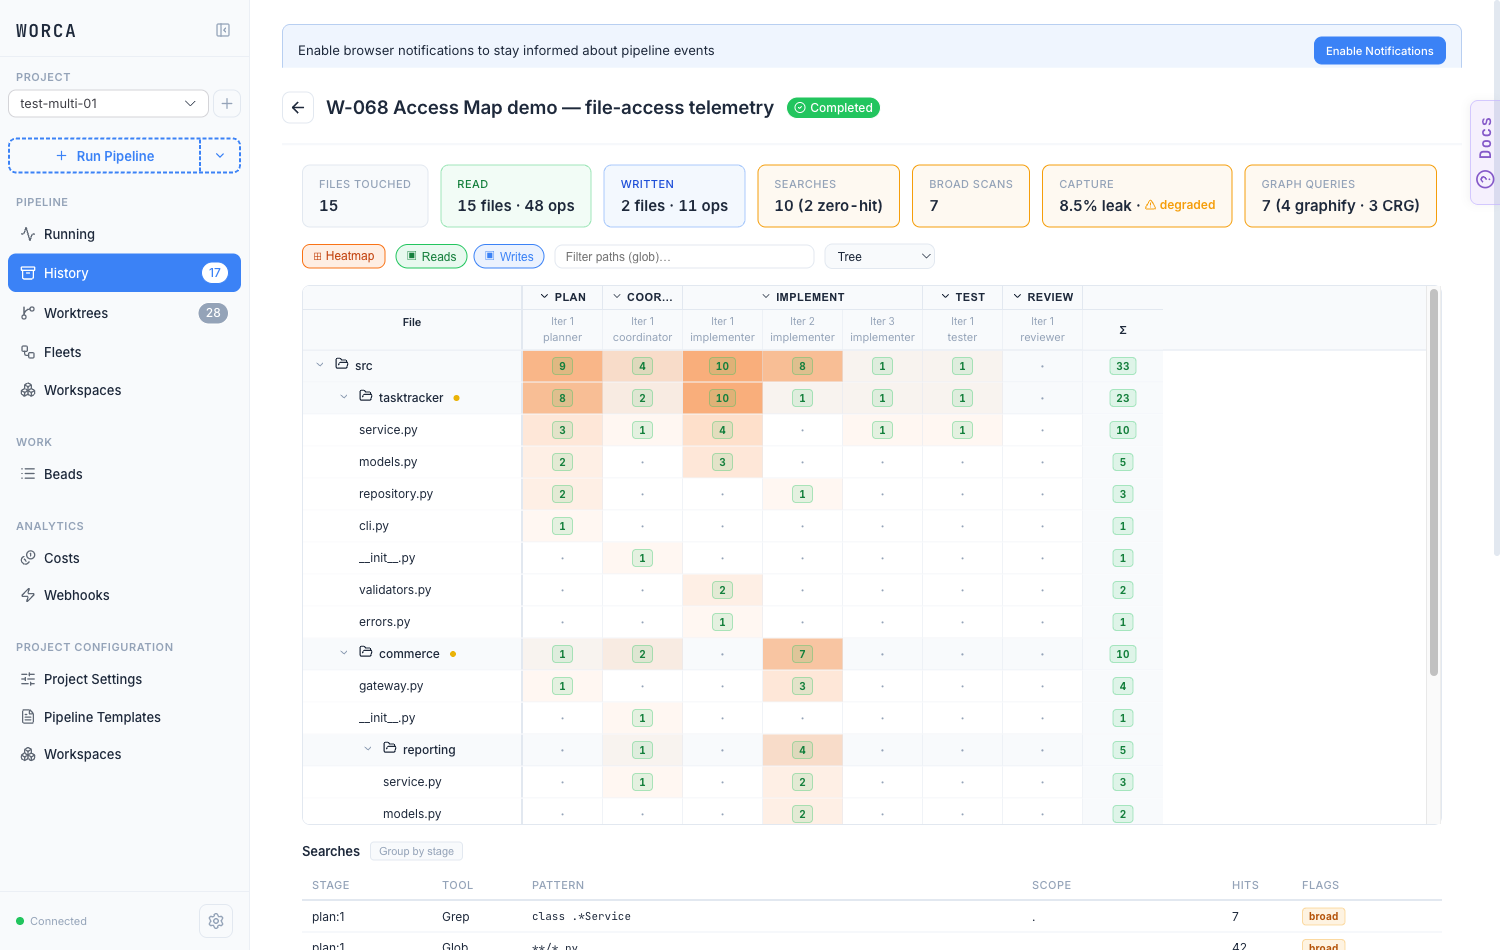
The matrix
Section titled “The matrix”The grid is the heart of the view.
- Rows are files, laid out as a collapsible directory tree. Each folder row rolls up its children, so a collapsed directory still shows its combined totals. Click a folder’s chevron to fold it; click a file name to open a drawer with that file’s full per-stage history.
- Columns are stage iterations. They’re grouped under the stage that produced them (
PLAN,IMPLEMENT, …) and labelled Iter 1, Iter 2, … within each stage, matching the stage names elsewhere in the UI. The agent that ran each iteration is shown beneath the label. - Cells are op pills. A green pill is the number of reads, a blue pill the number of writes (so a file read 9 times in the planner shows a green
9). An empty cell is a dot. - The Σ column on the right totals each row’s reads and writes across the whole run.
A few interactions make large runs manageable:
- Collapse a stage — click a stage header (e.g.
IMPLEMENT) to fold all its iteration columns into a single Σ column showing that stage’s combined total. Handy when one stage has many parallel iterations. - Heatmap — shades every cell orange in proportion to how much it was touched, so the hot files jump out at a glance. It’s on by default (shown above); toggle Heatmap off for a flat view.
The panels
Section titled “The panels”The cards across the top summarise the run:
| Panel | What it tells you |
|---|---|
| Files touched | Distinct files read or written by any agent. |
| Read (green) | Distinct files read, and total read operations. |
| Written (blue) | Distinct files written, and total write operations. |
| Searches | Grep/Glob searches run, and how many returned zero hits. |
| Broad scans | Searches scoped to the repo root (.) instead of a subdirectory — a sign the agent wasn’t sure where to look. |
| Capture | How reliable the telemetry is — see Capture integrity. |
| Graph queries | Structural queries against a code knowledge graph (graphify / CRG), shown only when a graph engine was used. |
The last two — Capture and Graph queries — share an amber style: both describe how the agents oriented themselves and how much to trust the telemetry, rather than what they touched.
Hover any panel for a one-line explanation.
Filters and sorting
Section titled “Filters and sorting”- Reads / Writes chips toggle those file rows on or off in the matrix. (Searches and graph queries are always shown in their own lanes below — they were never matrix rows.)
- The path filter narrows the tree to files matching a glob (e.g.
src/**/*.py). - The sort dropdown reorders files by Tree (hierarchy), Most read, Most written, or Most touched (reads + writes combined).
Searches and graph queries
Section titled “Searches and graph queries”Below the matrix, two lanes record how the agents looked for things — distinct from the files they ended up reading.
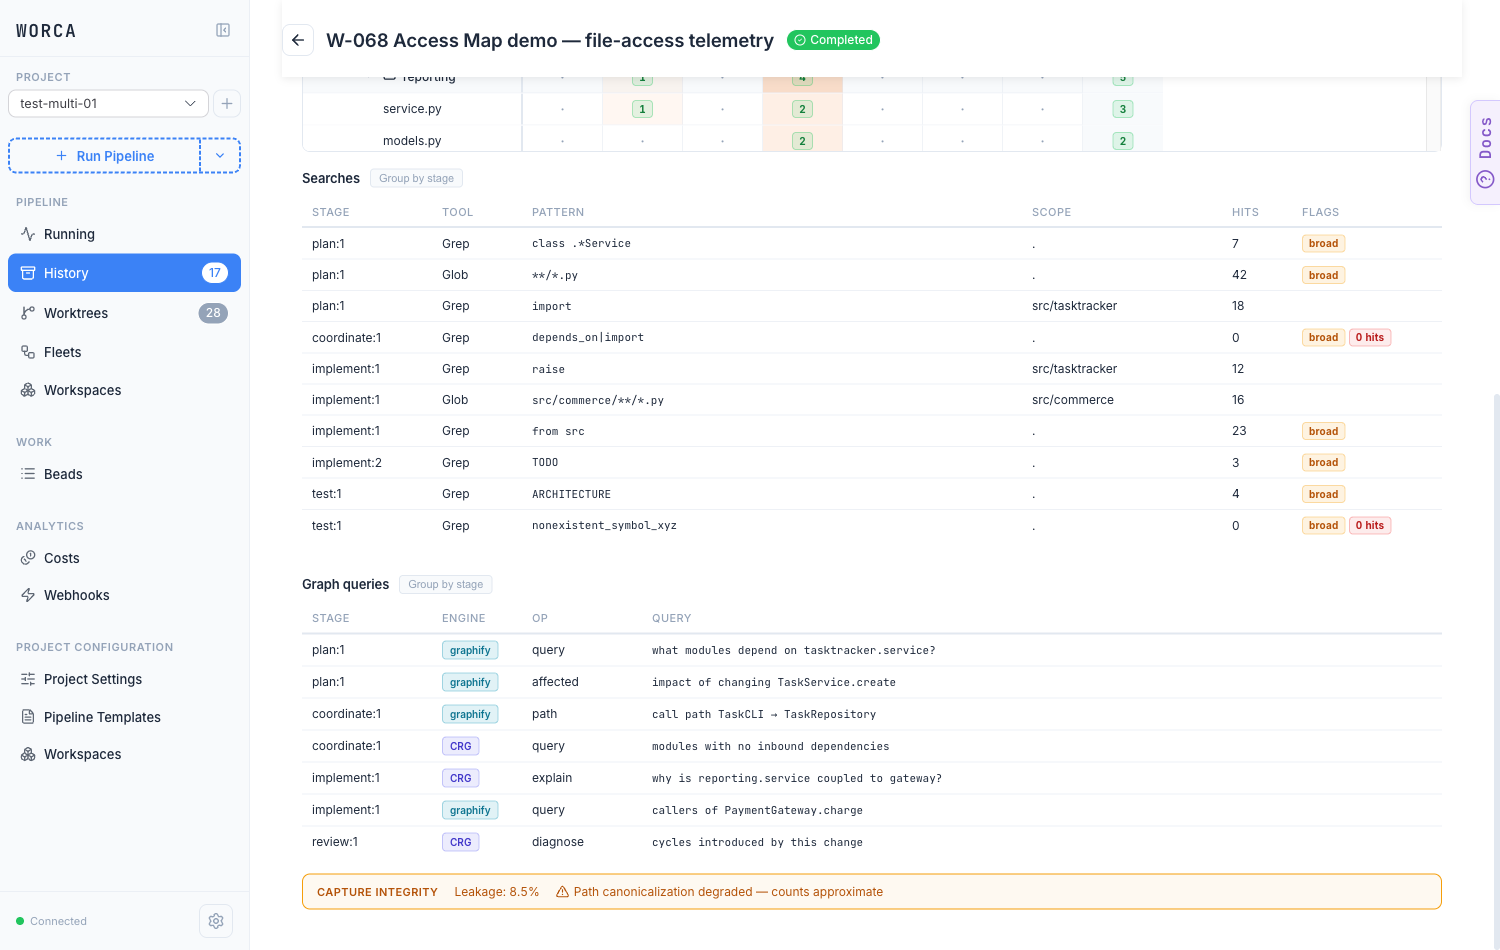
- Searches lists every Grep/Glob call with its pattern, scope, and hit count. Two flags surface waste: broad (scanned the repo root) and 0 hits (found nothing). A run full of broad, zero-hit searches usually means the agents were flailing — often a cue to improve the plan or add a knowledge graph.
- Graph queries lists the structural/semantic lookups agents made against a code knowledge graph — graphify over the CLI or code-review-graph over MCP. Each row shows the engine, the op (graphify subcommand or CRG tool), and the query. This lane only appears when a graph engine was enabled for the run.
Both lanes have a Group by stage toggle that splits the table into per-stage sections.
Capture integrity
Section titled “Capture integrity”File-access counts are only as good as worca’s ability to observe every operation, so the view is honest about its own reliability. The Capture panel and the strip at the bottom report two things:
- Leakage % — the share of writes worca couldn’t attribute to a specific stage/agent (for example, a file changed by a shell redirect rather than a tracked
Write/Edit). Lower is better. - Oracle —
okwhen path canonicalization succeeded for every event, ordegradedwhen it failed for some, meaning the counts are approximate rather than exact.
When you see a degraded oracle or high leakage, treat the matrix as a strong signal rather than an exact ledger.
Enabling and disabling
Section titled “Enabling and disabling”The telemetry is controlled by a single setting:
{ "worca": { "telemetry": { "file_access": { "enabled": true } } // default }}Set it to false to stop recording (the Access button still appears, but runs made while it’s off show the empty state). There is no per-stage configuration — capture is all-or-nothing for a run.